
Accounting Basics · New 2026 Edition
Balance Sheet Simple Guide
Everything a beginner needs to read, understand, and actually use a balance sheet — explained in plain English.
📋 Key Takeaways
- A balance sheet shows what a company owns, owes, and what’s left over — at one specific moment in time
- It always follows one rule: Assets = Liabilities + Equity
- Unlike the income statement, a balance sheet is a snapshot, not a video of activity over time
- Banks, investors, and tax authorities all rely on the balance sheet to judge financial health
- A few simple ratios — like the current ratio — can tell you a lot about a company in seconds
You usually need a balance sheet at the worst possible moment. The bank asks for one. An investor wants it by Friday. Your accountant starts asking questions you can’t quite answer. And suddenly you’re staring at a spreadsheet full of numbers wondering what any of it actually means.
Here’s the good news — a balance sheet isn’t as complicated as it looks. As GrowthGrid puts it, once you strip away the jargon, it’s really just answering one question: what your business has, minus what it owes, equals what you truly own.
By the end of this guide, you’ll know exactly what a balance sheet is, how it’s structured, how to read one in under five minutes, and which simple ratios actually matter.
What Is a Balance Sheet?
A balance sheet is a financial statement that shows what a company owns, what it owes, and what’s left over for its owners — all at one specific point in time. Accountants sometimes call it a “statement of financial position,” because that’s exactly what it is.
According to a 2026 breakdown by Comstock Interactive Data, the balance sheet captures a company’s financial health like a photograph — a single frozen moment, not a moving picture. This is the biggest difference between a balance sheet and an income statement, which instead tracks performance over weeks, months, or a full year.
Think of it this way — if your income statement is the story of your month, the balance sheet is a single photo taken at midnight on the last day of that month. It freezes everything: how much cash you have, how much you owe the bank, how much equipment sits in the warehouse.
This equation never breaks. Every single asset a business owns was either paid for with borrowed money (a liability) or with the owner’s own money (equity). If the two sides ever stop matching, something in the books is wrong — its as simple as that.
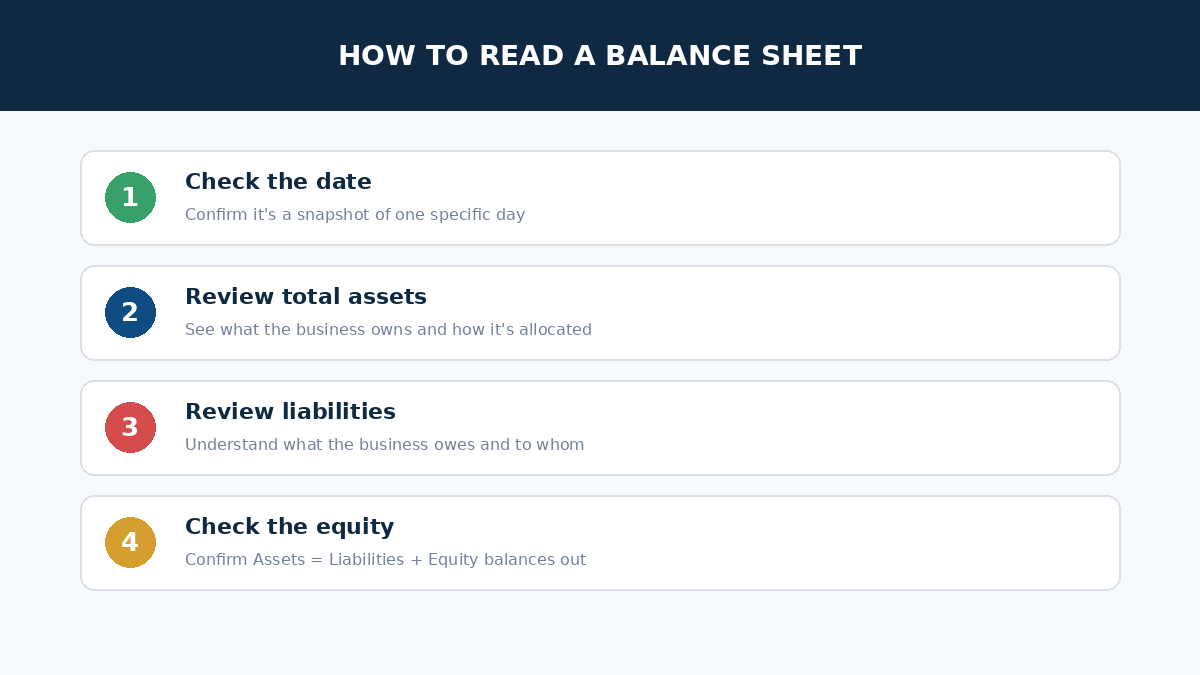
Fig 2. The accounting equation is the foundation every balance sheet is built on
The 3 Parts of a Balance Sheet
Every balance sheet — no matter how big or small the business — breaks down into the same three sections. Here’s what each one really means:
Assets
Everything the business owns that has value — cash, inventory, equipment, property
Liabilities
Everything the business owes — loans, unpaid bills, taxes, wages owed to staff
Equity
What’s actually left for the owners after every debt is subtracted from assets
As explained in a 2026 balance sheet guide by Nova, this formula ensures every dollar invested or earned in a business gets accounted for somewhere — nothing is allowed to simply disappear.
Current vs Non-Current: Breaking Down Assets and Liabilities
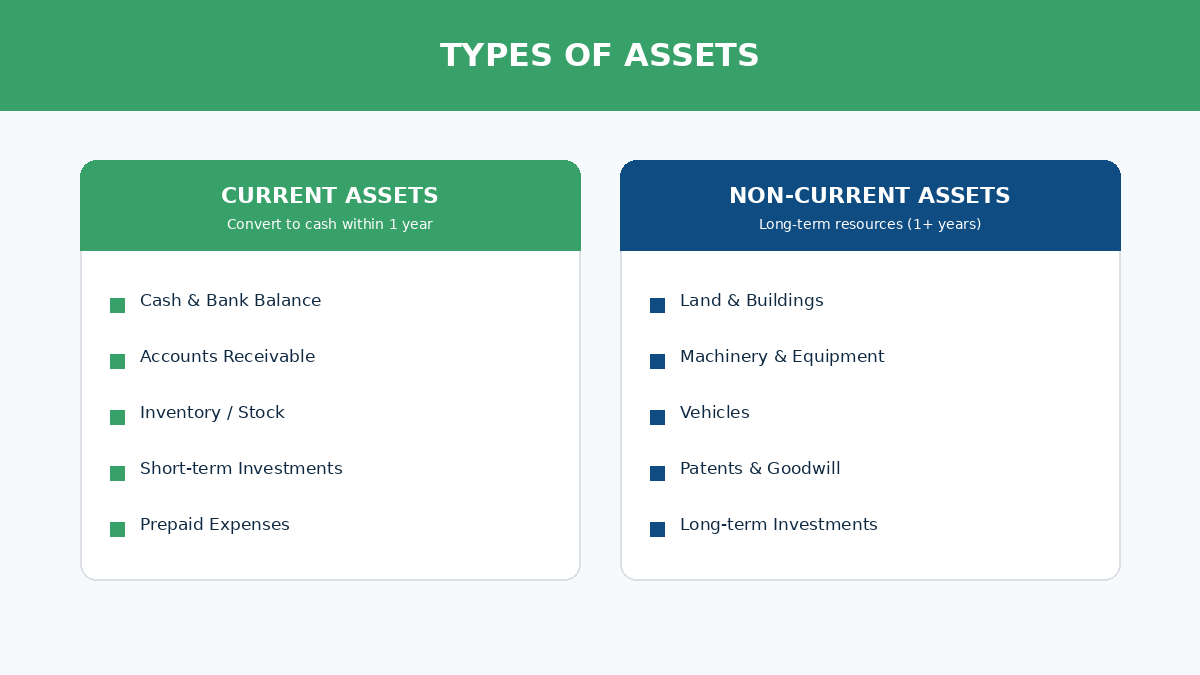
Assets and liabilities don’t just sit in one giant pile — they’re split based on how quickly they can be turned into cash, or how soon they need to be paid off.
| Category | Definition | Examples |
|---|---|---|
| Current Assets | Convertible to cash within 1 year | Cash, receivables, inventory |
| Non-Current Assets | Held for more than 1 year | Property, equipment, patents |
| Current Liabilities | Due within 1 year | Accounts payable, short-term loans |
| Non-Current Liabilities | Due after more than 1 year | Long-term loans, mortgages, bonds |
According to EdgeNRoots’ 2025–2026 format guide, most businesses today list their balance sheet vertically, with assets at the top followed by liabilities and equity below — this is known as the report format, and it’s by far the most common layout used worldwide.
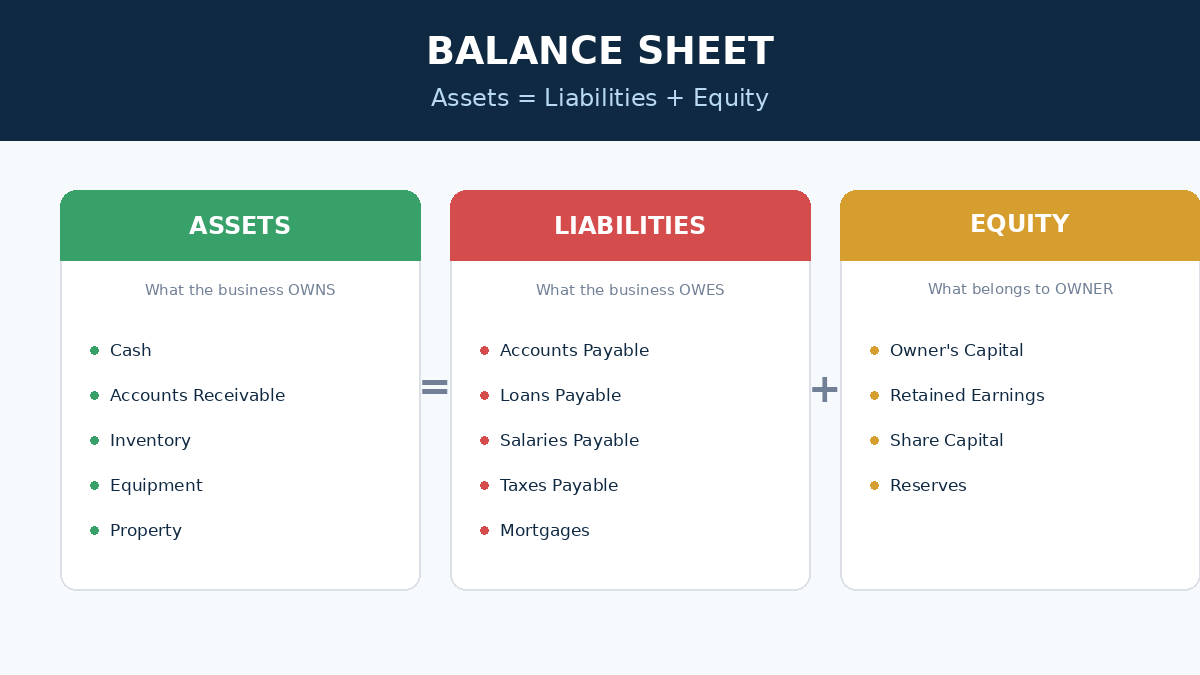
Fig 3. A simple balance sheet example split into current and non-current sections
How to Read a Balance Sheet in 5 Minutes
You don’t need an accounting degree to make sense of a balance sheet. Here’s a simple example of what one looks like for a small business:
| Assets | |
|---|---|
| Cash | $800,000 |
| Accounts Receivable | $600,000 |
| Inventory | $400,000 |
| Property & Equipment | $2,500,000 |
| Total Assets | $4,300,000 |
A real-world example documented by Comstock Interactive Data shows a company holding $1.8 million in current assets and $3.2 million in non-current assets — and breaking it down this way instantly tells you how much of the business is liquid versus locked into long-term resources.
Here’s the 3-step reading process most professionals follow: first, check that assets equal liabilities plus equity. Second, compare current assets to current liabilities — this tells you about short-term safety. Third, look at the debt-to-equity relationship to understand how leveraged the business really is.
Fig 4. Reading a balance sheet gets faster with practice — most professionals scan it in under 5 minutes
3 Simple Ratios That Actually Matter
You don’t need a dashboard full of jargon to understand a balance sheet. As a 2026 guide from Bookkeeping and Accounting Inc points out, just a handful of useful calculations go a long way.
Liquidity
Current Ratio
Current Assets ÷ Current Liabilities
Tells you if near-term resources can cover near-term obligations. Ideal range is 1.5x to 3.0x.
Leverage
Debt-to-Equity Ratio
Total Liabilities ÷ Equity
Shows how much of the business is funded by debt versus the owner’s own capital.
Cash Health
Working Capital
Current Assets − Current Liabilities
Simple and practical — a positive number means you have breathing room day to day.
Balance Sheet vs Income Statement — What’s the Difference?
These two get confused all the time, and it makes sense why — they’re both core financial statements that show up together in every annual report.
As noted in Nova’s balance sheet guide, the income statement (P&L) measures performance over a period of time, while the balance sheet captures resources and claims against them at a single date. One shows the movie, the other shows the photo — and you really need both to understand the full picture.
- Balance sheet — snapshot at one date, shows assets, liabilities, equity
- Income statement — covers a period of time, shows revenue, expenses, profit
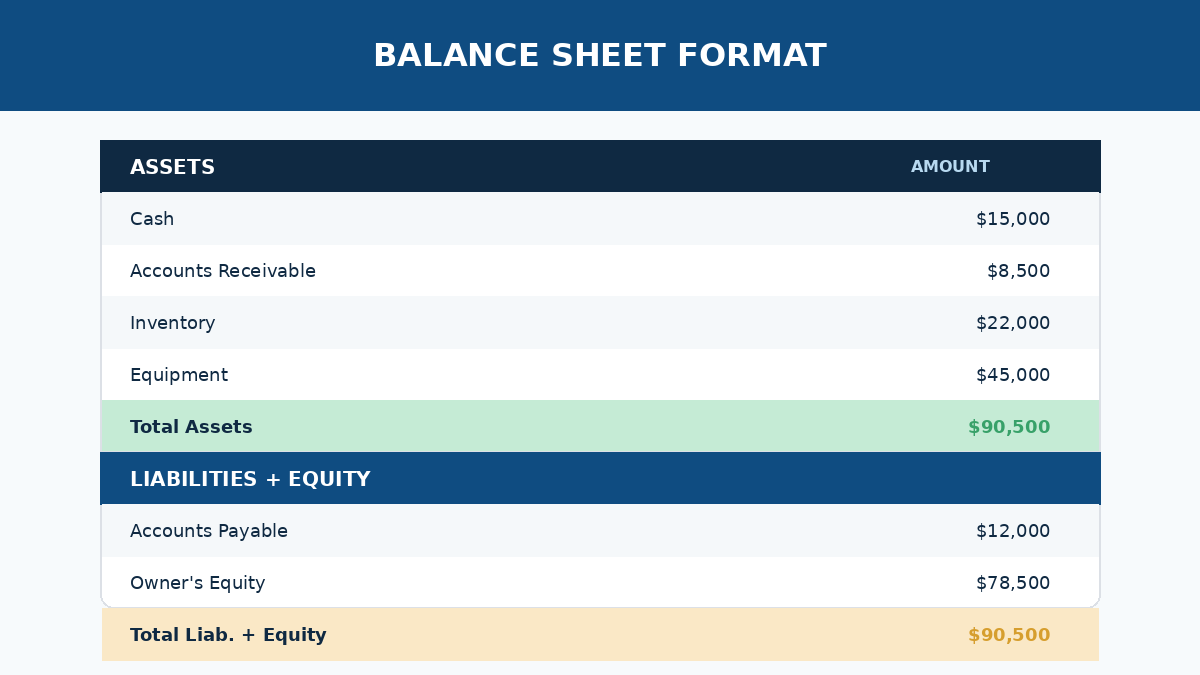
Fig 5. Balance sheet and income statement work together but answer very different questions
Frequently Asked Questions About Balance Sheets
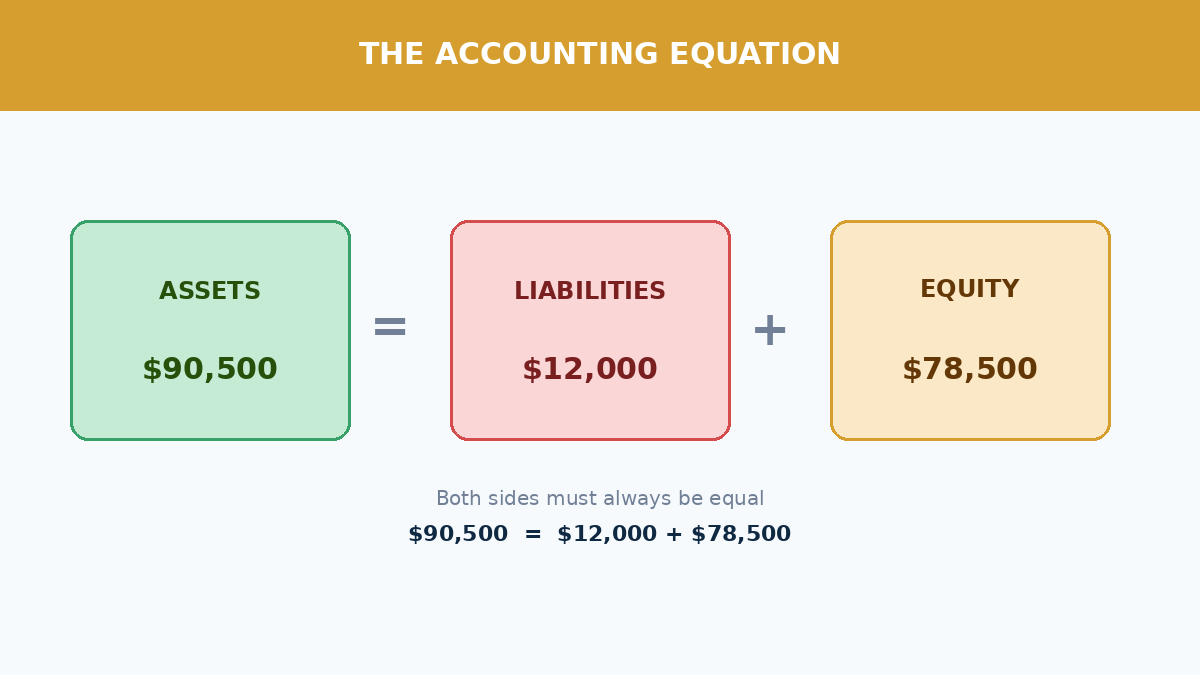
Fig 6. Reviewing your balance sheet regularly helps catch problems before they grow
this is for your information
Final Thoughts
A balance sheet isn’t a scary document reserved for accountants and bankers — it’s simply a snapshot of what your business has, what it owes, and what’s truly yours. Once that clicks, the whole thing stops feeling intimidating.
Start small: pull up your own balance sheet, or a public company’s annual report, and check that the equation balances. Then look at the current ratio. Then check the debt-to-equity relationship. Within a few tries you’ll be reading balance sheets faster than you ever thought possible.
The most important step is simply starting. Pull up the numbers, apply what you’ve learned here, and you’ll be surprised how quickly the picture becomes clear.
Want to learn more?
Master the Full Financial Picture
Understanding the balance sheet is step one. Explore our other guides to see how it connects to the income statement and cash flow.