
Complete Beginner Guide · Updated 2026
Financial Statements Explained
Everything a beginner needs to understand the balance sheet, income statement, and cash flow statement — in plain English.
📋 Key Takeaways
- There are 4 core financial statements every business uses — balance sheet, income statement, cash flow, and equity statement
- The balance sheet shows what a company owns and owes at one specific point in time
- The income statement tracks revenue and expenses over a period (month, quarter, or year)
- The cash flow statement tells you if a business actually has real cash — even profitable companies can run out of it
- Reading all three together gives you the complete financial picture of any business
Most people hear “financial statements” and immedately feel a little panic. Numbers, jargon, rows of data — it looks complicated. But here is the truth: financial statemnts are just a story. They tell you where a company’s money came from, where it went, and how much is left. Once you understand the three main chapters of that story, you can read any business’s finances with confidence.
According to a 2026 analysis by Beancount, nearly 82% of small businesses that fail cite cash flow problems as a contributing factor — yet many of those same owners admit they rarely look at their financial statements. This guide will change that for you.
Whether your a business owner, an investor, or a student just starting out — by the end of this guide you’ll know exactly what each statement does, how to read it, and why it matters in 2026.
What Are Financial Statements? (Simple Definition)
Financial statements are formal reports that summarise a company’s financial activity and position. They follow standardised formats based on Generally Accepted Accounting Principles (GAAP) or International Financial Reporting Standards (IFRS), which means lenders, investors, and tax authorties can all read them the same way.
Think of them as the annual health checkup report for a business. Just like a doctor checks your blood pressure, weight, and cholesterol to understand your overall health — financial statements check a company’s revenue, debt, and cash to understand its financial health.
As the U.S. Securities and Exchange Commission (SEC) explains it simply: they show you where a company’s money came from, where it went, and where it is now. There are four main types:
Balance Sheet
What the company owns and owes at a specific moment
Income Statement
Revenue, expenses, and profit over a time period
Cash Flow Statement
Real cash moving in and out of the business
Equity Statement
Changes in shareholder ownership value over time
How to Read a Balance Sheet
A balance sheet shows exactly what a company owns (assets), what it owes (liabilities), and what is left for the owners (equity) — all at one specific point in time. It’s like a photograph of the business’s finances on a single day.
The balance sheet always follows one golden equation:
Here’s what each part means in plain terms:
- Assets — everything the company owns that has value. This includes cash, stock/inventory, buildings, equipment, and even intellectual property like patents and trademarks.
- Liabilities — everything the company owes to others. Bank loans, unpaid bills, tax obligations, and employee salaries owed all count as liabilities.
- Shareholders’ Equity — the remaining value after you subtract liabilities from assets. This is what the business is actually worth to its owners.
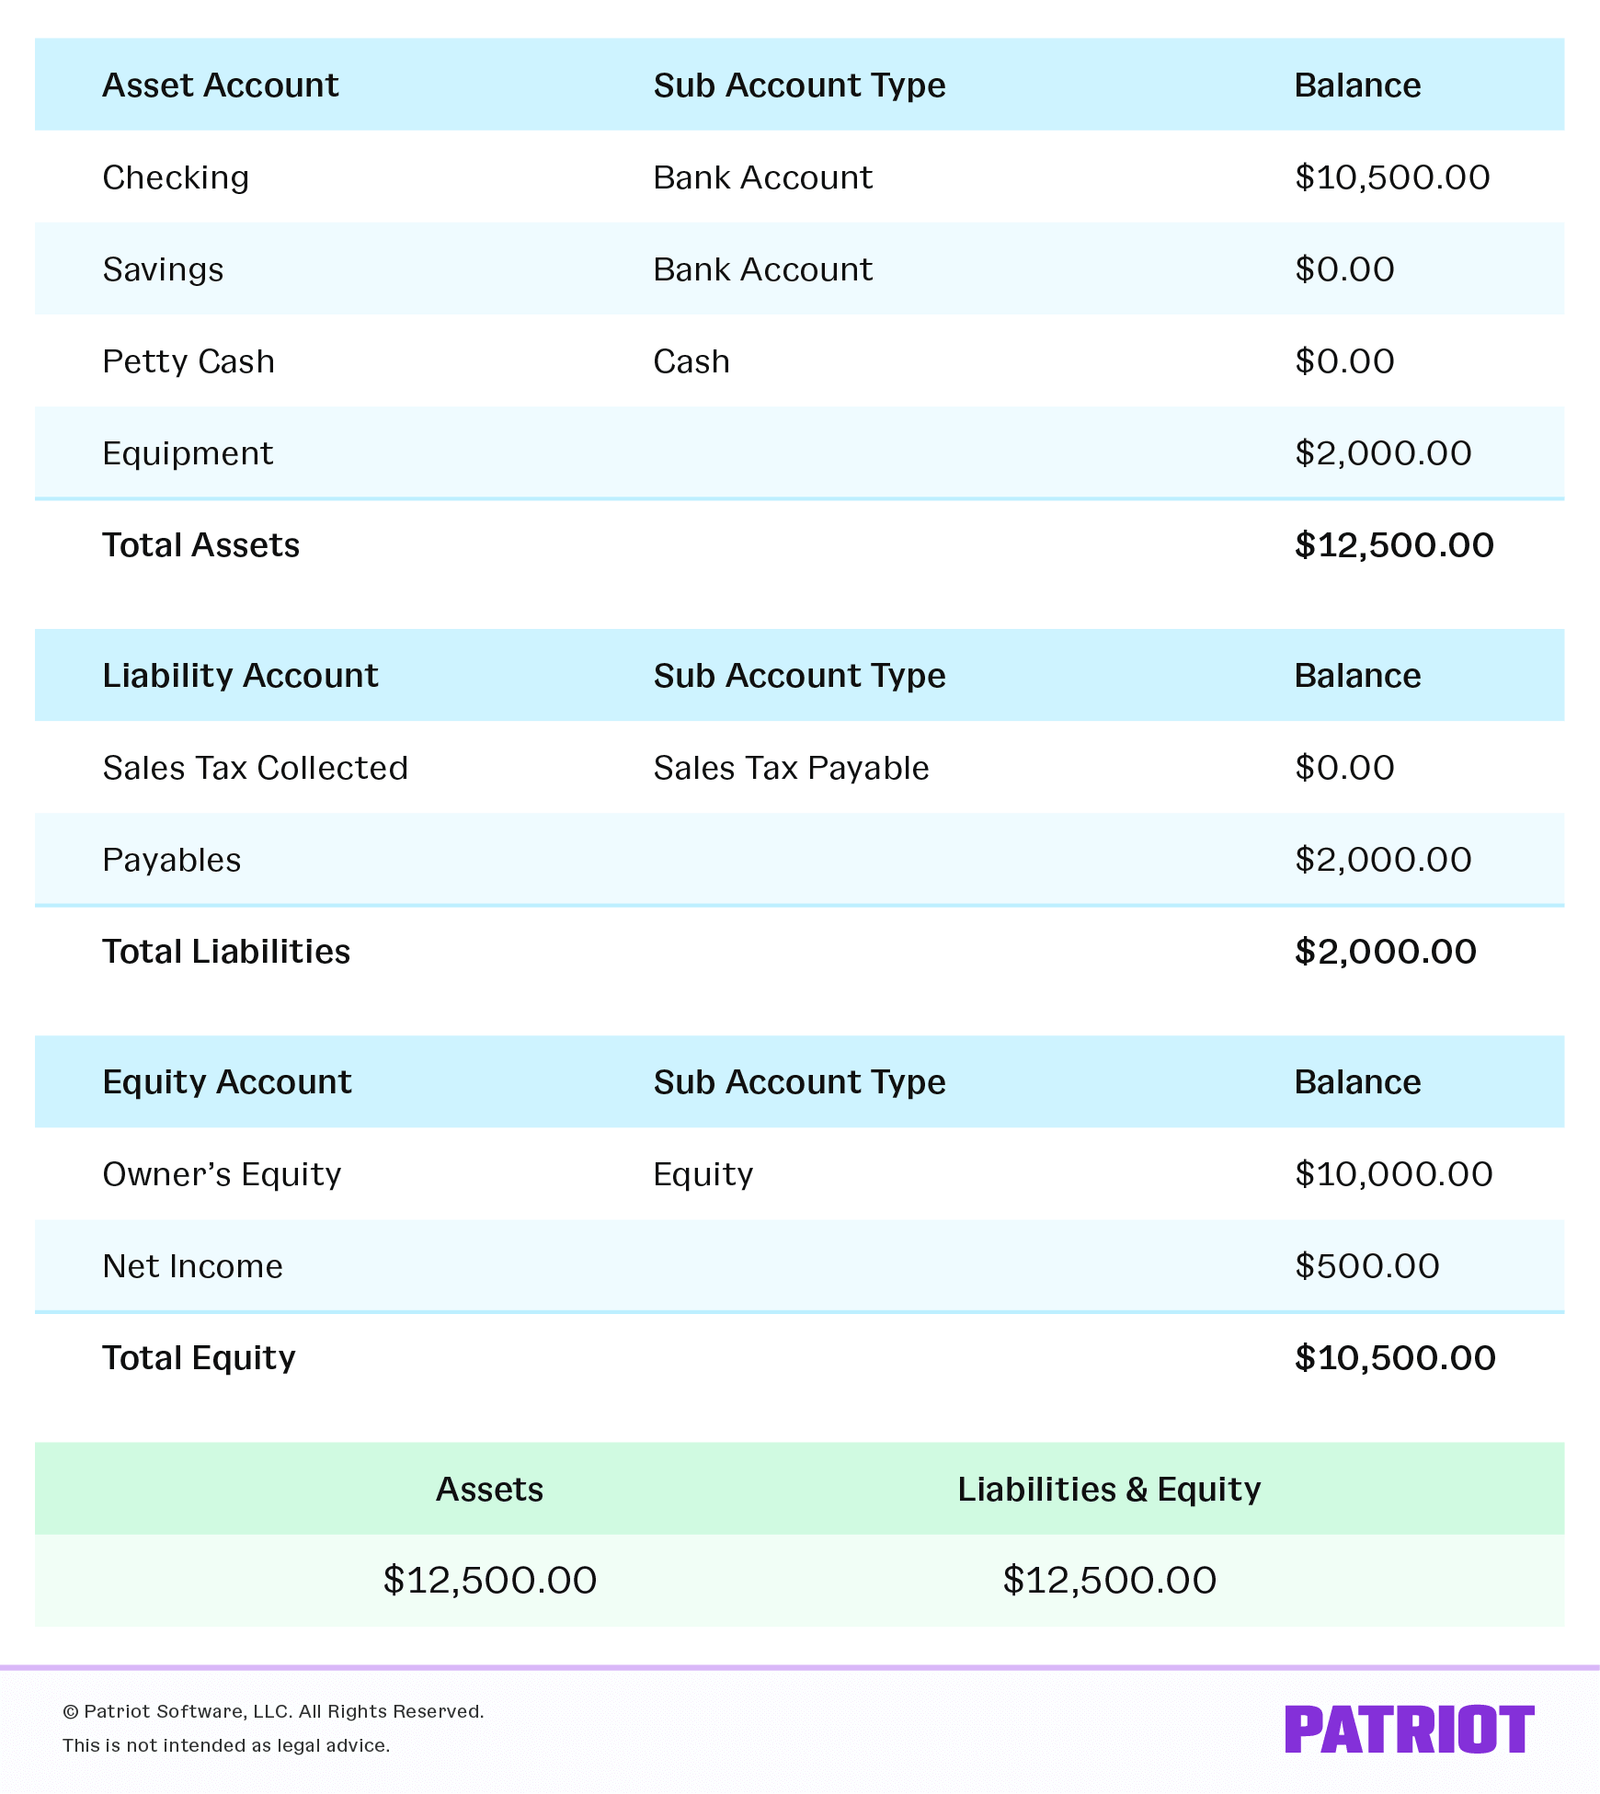
Fig 2. A simple balance sheet example — assets on the left, liabilities and equity on the right
One important thing to remember: the balance sheet only captures a single moment in time. It dosen’t show trends or tell you if things are getting better or worse. That’s exactly why you need to read it alongside the income statement and cash flow statement.
How to Read an Income Statement
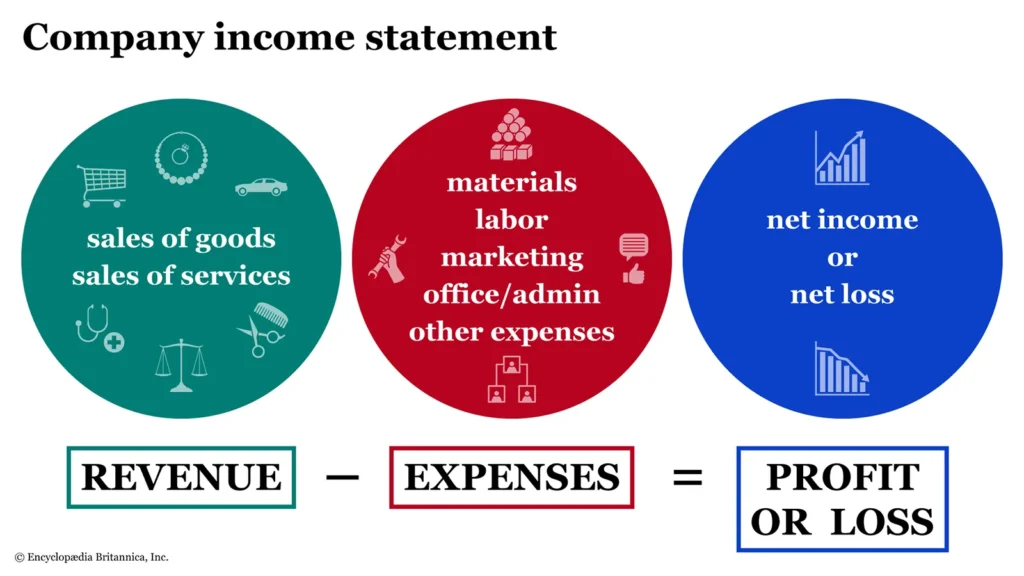
The income statement — also called the profit and loss (P&L) statement — shows how much money a company made and spent over a specific time period. That period could be a month, a quarter, or a full financial year.
Unlike the balance sheet (which is a snapshot), the income statement is more like a video — it shows the story of what happened between two dates. According to Ramp’s 2026 finance guide, this is the statement most business owners should start with because it directly answers the most critical question: is this business profitable?
The income statement typically breaks down like this:
| Line Item | What It Means | Example ($) |
|---|---|---|
| Revenue | Total money earned from sales | $500,000 |
| Cost of Goods Sold (COGS) | Direct costs to make/deliver the product | ($200,000) |
| Gross Profit | Revenue minus COGS | $300,000 |
| Operating Expenses | Rent, salaries, marketing, utilities | ($150,000) |
| Net Profit (Bottom Line) | What’s left after ALL expenses | $150,000 |
The “bottom line” is literally the last line of the income statement — net profit (or net loss). Its the number that tells you if the business is making money after paying for everything. A company can have huge revenue and still lose money if its expenses are out of control.
How to Read a Cash Flow Statement
The cash flow statement tracks the actual movement of real cash into and out of a business during a specific period. This is arguably the most important statement for day-to-day survival — because a business can be profitable on paper and still go bankrupt if it runs out of cash.
Here’s a real example: imagine a consulting firm that completed $200,000 worth of projects in December. They’ve earned that revenue. But if their clients don’t pay until February, the business might not have enough cash to pay staff salaries in January. The income statement shows profit — but the cash flow statement shows the reality.
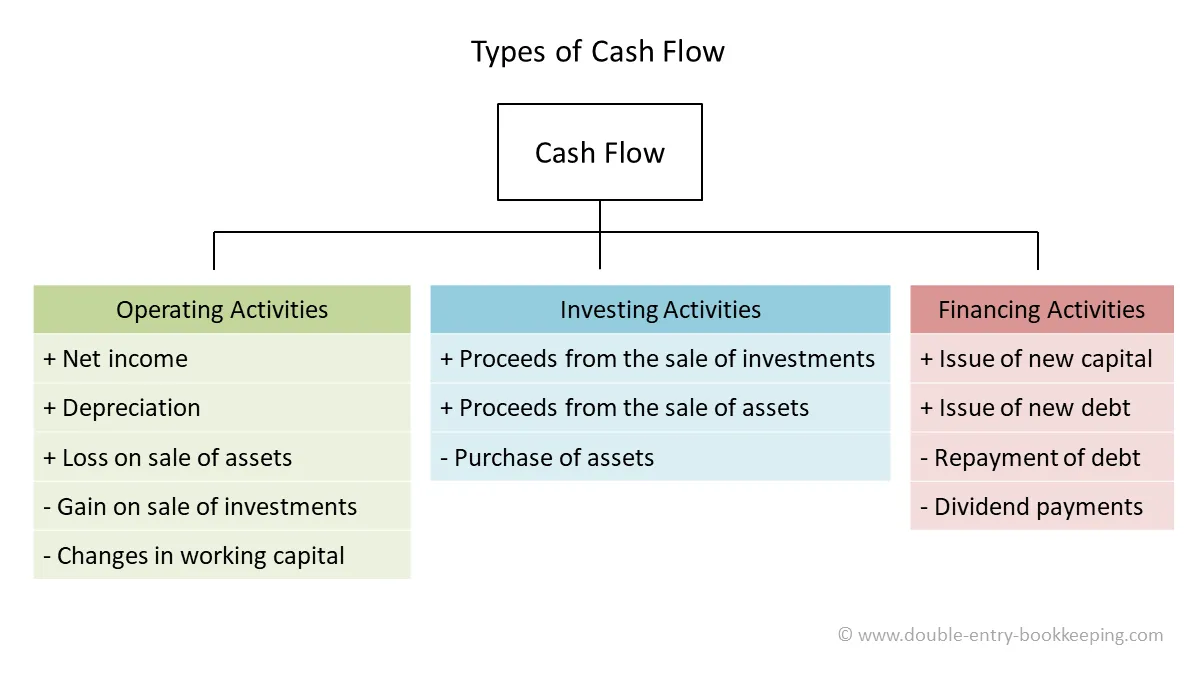
Fig 3. Cash flow is divided into three sections — operating, investing, and financing activities
The cash flow statement is divided into three sections:
1. Operating Activities
Cash generated from core day-to-day business operations — selling products, collecting payments, paying suppliers
2. Investing Activities
Cash used to buy or sell long-term assets — equipment, property, investments in other companies
3. Financing Activities
Cash from borrowing or repaying loans, issuing shares, or paying dividends to shareholders
Idealy, a healthy business generates more cash from operating activities than it spends. If operating cash flow is consistently negative while the income statement shows profit, thats a big red flag worth investigating.
How the 3 Financial Statements Work Together
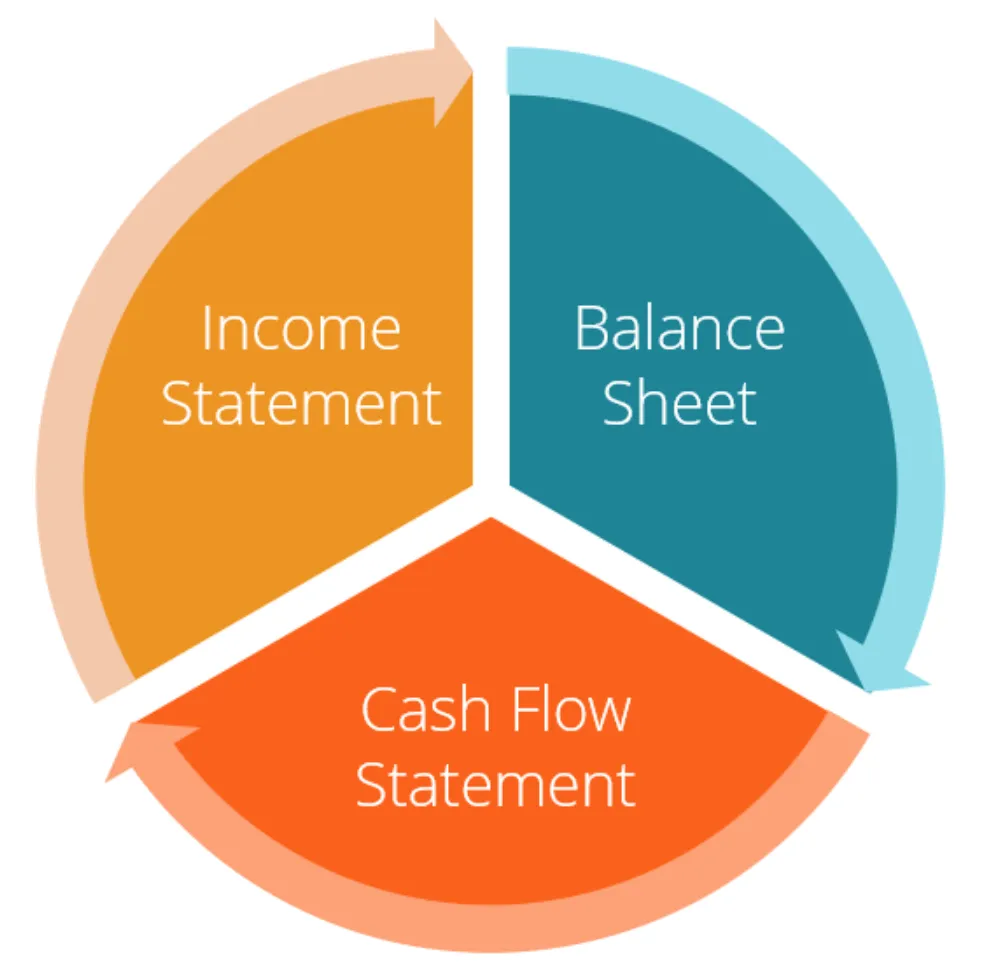
No single statement tells the complete story. The real power comes from reading all three together. Here’s how they connect:
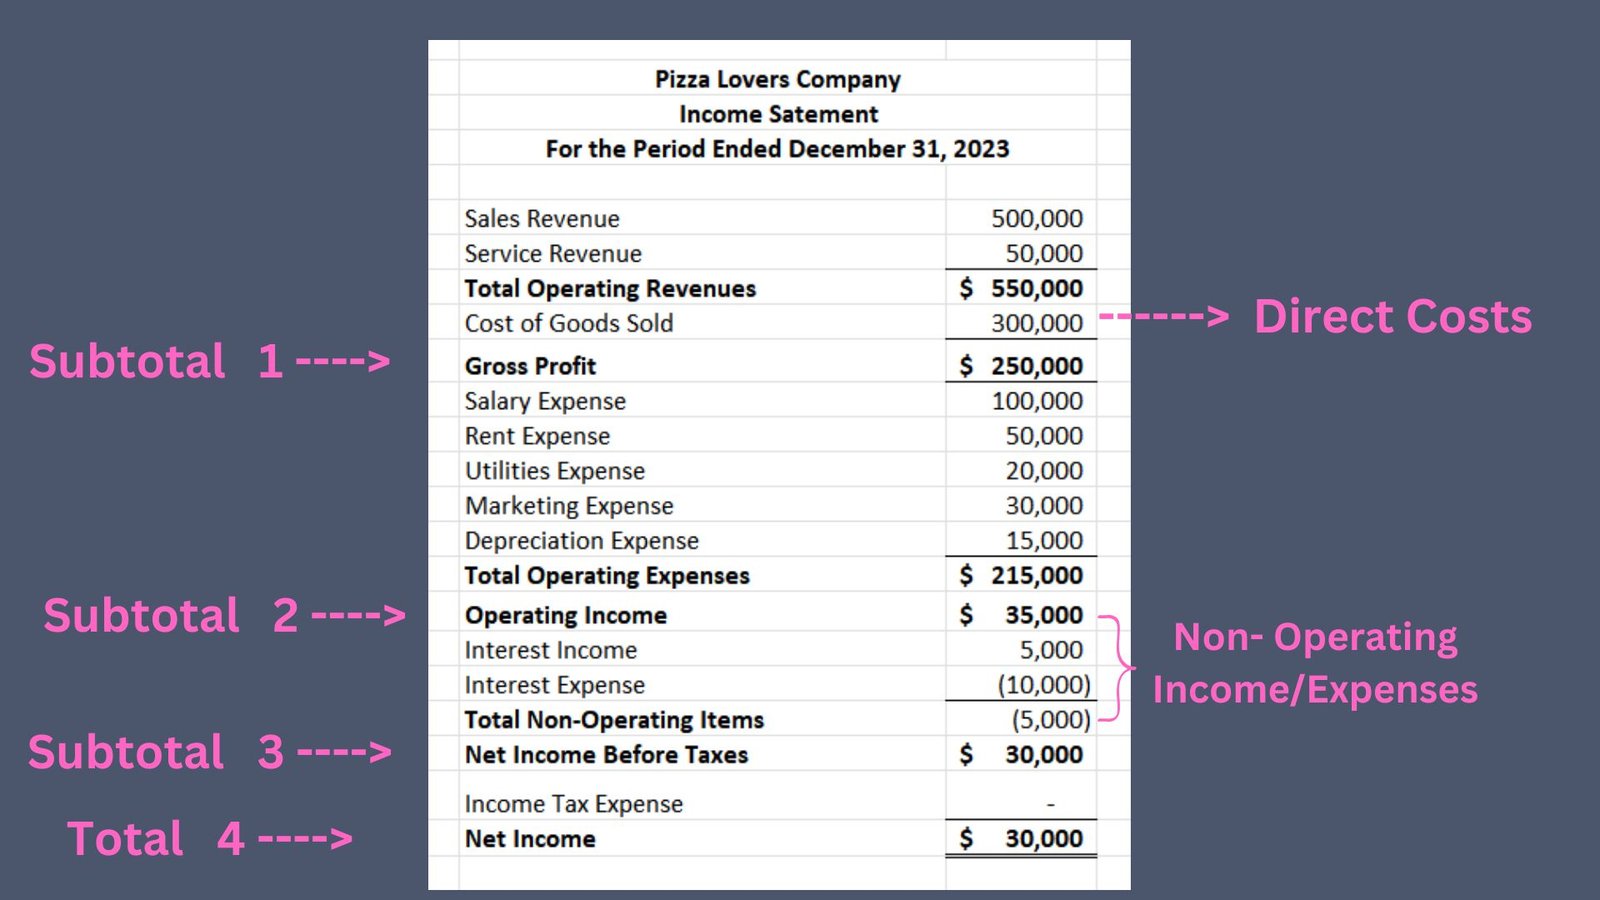
Fig 4. How the three core financial statements link and feed into each other
- Net income from the income statement flows directly into the equity section of the balance sheet
- The opening and closing cash balance on the cash flow statement matches the cash line on the balance sheet
- Revenue growth on the income statement should ideally be matched by growing cash from operating activities on the cash flow statement
- Rising debt on the balance sheet will show up as financing activity on the cash flow statement
According to Harvard Business School Online, reading these reports in combination is the only way to fully understand a company’s financial position. Each statement validates and contextualises the others.
5 Key Financial Ratios Every Beginner Should Know
Once you can read the statements, ratios help you interpret what the numbers actually mean. These five are the most useful starting points:
Liquidity
Current Ratio
Current Assets ÷ Current Liabilities
A ratio above 1.5 means the company can comfortably pay its short-term debts
Profitability
Net Profit Margin
Net Profit ÷ Revenue × 100
Shows what percentage of revenue actually becomes profit after all costs
Debt
Debt-to-Equity Ratio
Total Liabilities ÷ Shareholders’ Equity
A lower number means the business relies less on borrowing to fund itself
Efficiency
Return on Assets (ROA)
Net Income ÷ Total Assets × 100
Tells you how efficently the company turns its assets into profit
Cash Health
Operating Cash Flow Ratio
Operating Cash Flow ÷ Current Liabilities
Measures whether the company generates enough cash to cover its immediate obligations
Frequently Asked Questions About Financial Statements
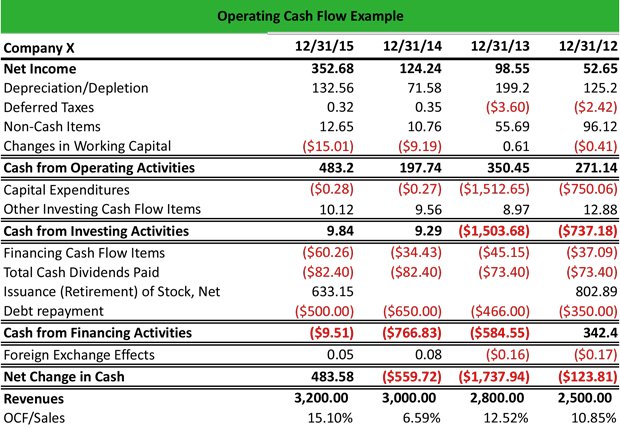
Fig 5. Reviewing financial statements regularly helps you spot problems early and plan for growth
Final Thoughts
Financial statements aren’t reserved for accountants and Wall Street analysts. Every business owner, investor, and financially curious person can learn to read them — and should. The balance sheet tells you where you stand. The income statement tells you how you got there. The cash flow statement tells you whether you’ll survive the journey.
Start with the basics: find a company’s annual report (any public company publishes one for free), open the income statement, and ask yourself — are revenues growing? Are expenses under control? Is there a profit at the bottom? From there, check the balance sheet and cash flow, and suddenly you’re reading financial statements like a pro.
The most important step is simply to start. Pick up those reports, apply what you’ve learnt here, and the numbers will start making sense faster than you expect.
Ready to go deeper?
Start Tracking Your Own Financials Today
Understanding financial statements is step one. The next step is putting them to work for your own business or investment decisions.